We should check distribution for all the variables in the dataset and if it is skewed, we should use log transformation to make it normal distributed.
We will again use Ames Housing dataset and plot the distribution of "SalePrice" target variable and observe its skewness. We will use distplot method of seaborn library for this.
By default, distplot draws a histogram. A histogram represents the distribution of data by forming bins along the range of the data and then drawing bars to show the number of observations that fall in each bin.
For more information on bins, please go through this blog post.
Step 1: Load the required libraries
import pandas as pd
import numpy as np
import seaborn as sns
Step 2: Load the dataset
dataset = pd.read_csv("C:/datasets/train.csv")
Step 3: Draw a distribution plot
sns.distplot(dataset['SalePrice'])

We see that the target variable SalePrice has a right-skewed distribution. We need to log transform this variable so that it becomes normally distributed. A normally distributed (or close to normal) target variable helps in better modeling the relationship between target and independent variables. In addition, linear algorithms assume constant variance in the error term.
Alternatively, we can also confirm this skewed behavior using the skewness metric.
dataset['SalePrice'].skew()
Output: 1.88287575977
Step 4: Log Transform the Skewed Variable
Let's log transform this variable and see if this variable distribution can get any closer to normal.
target = np.log(dataset['SalePrice'])
print ('Skewness is', target.skew())
sns.distplot(target)
Output: Skewness is 0.12133506220520406
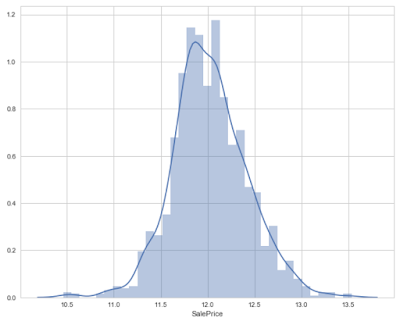
As you can see that log transformation of the target variable has helped us fixing its skewed distribution and the new distribution looks closer to normal. Since we have 80 variables, visualizing one by one wouldn't be a reasonable approach. Instead, we'll look at some variables based on their correlation with the target variable. However, there's a way to plot all variables at once, and we'll look at it as well in my later posts.
No comments:
Post a Comment