Linear Regression model basically finds out the best value for the intercept and the slope, which results in a line that best fits the data. Linear Regression can be classified as Simple Linear Regression and Multiple Linear Regression.
Linear Regression involving multiple variables is called Multiple Linear Regression. I implemented Simple Linear Regression in my previous article. In this article, we will implement Multiple Linear Regression. We will try to predict the petrol consumption in US.
You can download petrol_consumption.csv from here. You can also download my Jupyter notebook containing below code of Multiple Linear Regression.
Step 1: Import the required Python libraries like pandas, numpy and sklearn
import pandas as pd
import numpy as np
from sklearn.model_selection import train_test_split
from sklearn.linear_model import LinearRegression
from sklearn.metrics import mean_absolute_error, mean_squared_error
Step 2: Load and examine the dataset
names = ['Index', 'One', 'Petrol tax (cents per gallon)', 'Average income (dollars)',
'Paved Highways (miles)', 'Proportion of population with driver licenses',
'Consumption of petrol (millions of gallons)']
dataset = pd.read_csv('petrol_consumption.csv', names=names)
dataset.shape
dataset.head()
dataset.describe()
Please note that "describe()" is used to display the statistical values of the data like mean and standard deviation.
I got mean of the Consumption of petrol (millions of gallons) as 576.770833. I will use this value to evaluate the performance of the algorithm in step 8.
Step 3: Mention X and Y axis
X = dataset[['Petrol tax (cents per gallon)', 'Average income (dollars)',
'Paved Highways (miles)', 'Proportion of population with driver licenses']]
y = dataset['Consumption of petrol (millions of gallons)']
X contains the list of attributes
Y contains the list of labels
Step 4: Split the dataset into training and testing dataset
X_train, X_test, y_train, y_test = train_test_split(X, y, test_size = 0.20, random_state=0)
Step 5: Create and fit the model
model = LinearRegression()
model.fit(X_train, y_train)
Step 6: Print coefficient (slope) for all the features
In case of multi-variable linear regression, the regression model has to find the most optimal coefficients for all the attributes. To see what coefficients our regression model has chosen, execute the following script:
coeff_df = pd.DataFrame(model.coef_, X.columns, columns=['Coefficient'])
coeff_df
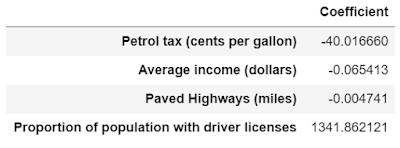
We can use these coefficients (slopes) to find out which feature has the highest impact on the predicted output and how different features relate to each other.
This means that for a unit increase in "Petrol Tax", there is a decrease of 40.01 million gallons in gas consumption. Similarly, a unit increase in proportion of population with a drivers license results in an increase of 1.341 billion gallons of gas consumption. We can see that "Average income" and "Paved Highways" have a very little effect on the gas consumption.
Step 7: Predict from the model
y_pred = model.predict(X_test)
The y_pred is a numpy array that contains all the predicted values for the input values in the X_test.
Lets see the difference between the actual and predicted values.
df=pd.DataFrame({'Actual':y_test, 'Predicted':y_pred})
df
Step 8: Check the accuracy
meanAbsoluteError = mean_absolute_error(y_test, y_pred)
meanSquaredError = mean_squared_error(y_test, y_pred)
rootMeanSquaredError = np.sqrt(meanSquaredError)
print('Mean Absolute Error:', meanAbsoluteError)
print('Mean Squared Error:', meanSquaredError)
print('Root Mean Squared Error:', rootMeanSquaredError)
I got Root Mean Square Error as 68.31064915215168 which is slightly higher than 10% of the mean value of the Consumption of petrol (millions of gallons) i.e. 576.770833 (look at step 2). This means that our algorithm needs improvement, but even then it did a decent job.
We can improve the performance of the algorithm by considering below points:
1. Gather more data: More the data, more the accuracy.
2. Visualizing the data: We made the assumption that this data has a linear relationship, but that might not be the case. Visualizing the data may help you determine that.
3. Hyperparameter Tuning: Use cross-validation and try different combinations of sub-sets and hyperparameters to gain accuracy.
4. Feature Extraction: We don't have sufficient features to accurately predict the petrol consumption. We should also use feature elimination and extraction techniques (dimensionality reduction techniques like PCA, MDS, LDA etc). We should eliminate the variables which have high correlation.
No comments:
Post a Comment