Pages

Sunday 31 March 2019

How to find Correlation Score and plot Correlation Heatmap using Seaborn Library in Python?

Lets try to find out the correlation among the variables in a dataset. Correlated variables don't provide any useful information to the model.We should remove correlated variables from the dataset for better accuracy and performance. 

We will analyze the correlation among the variables through correlation heatmap using seaborn library in Python. corr method is used to find out the correlation. Then we will also find the correlation score of the variables with respect to target variable.

Consider Ames Housing dataset. 

Step 1: Load the required libraries
import pandas as pd
import seaborn as sns
import matplotlib.pyplot as plt

Step 2: Load the dataset
dataset = pd.read_csv("C:/datasets/train.csv")

Step 3: Separate numeric and categorical variables
numeric_data = dataset.select_dtypes(include=[np.number])
categorical_data = dataset.select_dtypes(exclude=[np.number])

Step 4: Remove the Id column
del numeric_data['Id']

Step 5: Draw Correlation Heatmap
corr = numeric_data.corr()
plt.figure(figsize=(10, 10))
sns.heatmap(corr)


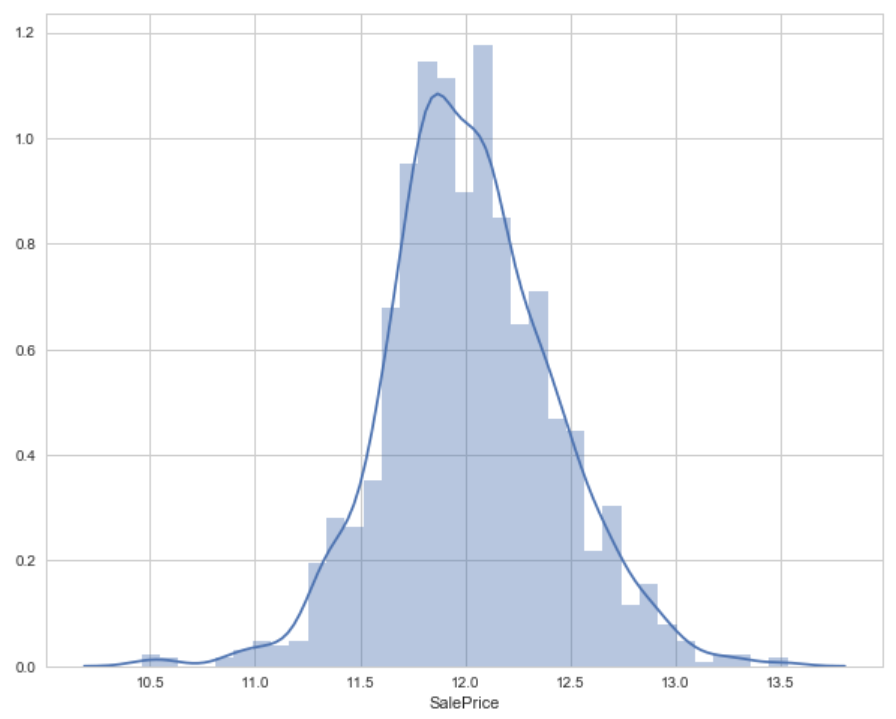
Notice the last row of this map. We can see the correlation of all the variables against SalePrice. As you can see, some variables seem to be strongly correlated with the target variable. 

Step 6: Get Correlation Score
print (corr['SalePrice'].sort_values(ascending=False)[:10]) #top 10 correlations
print (corr['SalePrice'].sort_values(ascending=False)[-5:]) #least 5 correlations


Here we see that the OverallQual feature is 79% correlated with the target variable. Overallqual feature refers to the overall material and quality of the materials of the completed house. Well, this make sense as well. People usually consider these parameters for their dream house. 

In addition, GrLivArea is 70% correlated with the target variable. GrLivArea refers to the living area (in sq ft.) above ground. The following variables show people also care about if the house has a garage, the area of that garage, the size of the basement area, etc.

How to separate numeric and categorical variables in a dataset using Pandas and Numpy Libraries in Python?

We treat numeric and categorical variables differently in Data Wrangling. So, you should always make at least two sets of data: one contains numeric variables and other contains categorical variables. We will use "select_dtypes" method of pandas library to differentiate between numeric and categorical variables.

Consider Ames Housing dataset. 

Step 1: Load the required libraries

import pandas as pd
import numpy as np

Step 2: Load the dataset

dataset = pd.read_csv("C:/datasets/train.csv")

Step 3: Separate numeric and categorical variables

numeric_data = dataset.select_dtypes(include=[np.number])
categorical_data = dataset.select_dtypes(exclude=[np.number])

numeric_data.shape
categorical_data.shape

There are 38 numeric and 43 categorical columns in the dataset. 

With numeric variables, you can impute missing values using mean, mode or median, replace invalid values, remove outliers, study the correlation among them, create bins using binning technique, implement feature engineering like standardization, normalization etc.

With categorical variables, you can impute missing values with new category or frequently occurring category, use label encoding, one hot encoding, dummies etc.

To know about detailed Data Wrangling steps, please visit my this post.

Log Transforming the Skewed Data to get Normal Distribution

We should check distribution for all the variables in the dataset and if it is skewed, we should use log transformation to make it normal distributed.

We will again use Ames Housing dataset and plot the distribution of "SalePrice" target variable and observe its skewness. We will use distplot method of seaborn library for this. 

By default, distplot draws a histogram. A histogram represents the distribution of data by forming bins along the range of the data and then drawing bars to show the number of observations that fall in each bin.

For more information on bins, please go through this blog post.

Step 1: Load the required libraries

import pandas as pd
import numpy as np
import seaborn as sns

Step 2: Load the dataset

dataset = pd.read_csv("C:/datasets/train.csv")

Step 3: Draw a distribution plot

sns.distplot(dataset['SalePrice'])


We see that the target variable SalePrice has a right-skewed distribution. We need to log transform this variable so that it becomes normally distributed. A normally distributed (or close to normal) target variable helps in better modeling the relationship between target and independent variables. In addition, linear algorithms assume constant variance in the error term.

Alternatively, we can also confirm this skewed behavior using the skewness metric.

dataset['SalePrice'].skew()

Output: 1.88287575977

Step 4: Log Transform the Skewed Variable

Let's log transform this variable and see if this variable distribution can get any closer to normal.

target = np.log(dataset['SalePrice'])
print ('Skewness is', target.skew())
sns.distplot(target)

Output: Skewness is 0.12133506220520406


As you can see that log transformation of the target variable has helped us fixing its skewed distribution and the new distribution looks closer to normal. Since we have 80 variables, visualizing one by one wouldn't be a reasonable approach. Instead, we'll look at some variables based on their correlation with the target variable. However, there's a way to plot all variables at once, and we'll look at it as well in my later posts.

Saturday 30 March 2019

Visualize missing values in Bar Plot using Seaborn Library

We will draw a bar plot to view number of missing values in Ames Housing dataset. For this we need to import seaborn and matplotlib libraries. Lets see how to draw a bar plot representing missing values in the dataset.

Step 1: Load the required libraries

import pandas as pd
import seaborn as sns
import matplotlib.pyplot as plt

Step 2: Load the dataset

dataset = pd.read_csv("C:/datasets/train.csv")

Step 3: Draw a bar plot

missing_values = dataset.isnull().sum() / len(dataset)
missing_values = missing_values[missing_values > 0]
missing_values.sort_values(inplace=True)
missing_values


Now lets create a pandas dataframe of above result:

missing_values = missing_values.to_frame()
missing_values.columns = ['count']
missing_values.index.names = ['Name']
missing_values['Name'] = miss.index

We have created two columns ("Name" and "count") in pandas dataframe. Finally, create a bar plot to represent missing values:

sns.set(style="whitegrid", color_codes=True)
sns.barplot(x = 'Name', y = 'count', data=missing_values)
plt.xticks(rotation = 90)
plt.show()


Friday 29 March 2019

What are Outliers? How to find and remove outliers using JointPlot in Seaborn Library?

Outliers are some of the data points which deviate a lot from the normal observation of the data. These outliers drastically degrade the performance and accuracy of the model. So, it is utmost important to remove the outliers from our dataset to get consistent results from the Machine Learning algorithms. 

We will use Ames Housing dataset and concentrate at "GrLivArea" feature. "GrLivArea" refers to the living area (in sq ft.) above ground. We will try to find out and remove outliers in this feature.

Step 1: Load the dataset

import pandas as pd
dataset = pd.read_csv("C:/datasets/train.csv")

Step 2: Data Exploration

dataset.shape 
dataset[["GrLivArea", "SalePrice"]]

We see that dataset has 1460 rows and 81 columns. Please note that I am not going to explore the entire dataset. I have written a complete post on data exploration here. I will only concentrate on the "GrLivArea" feature.

Step 3: Draw a plot between GrLivArea and SalePrice

import seaborn as sns
sns.jointplot(x=dataset['GrLivArea'], y=dataset['SalePrice'])


We can see from the above plot that there is a direct correlation of living area with sale price. We can also spot 4 outlier value i,e. GrLivArea > 4000 (see the data points in red highlighted box).  

Step 4: Remove the outliers

dataset.drop(dataset[dataset['GrLivArea'] > 4000].index, inplace=True)
dataset.shape

Now we get 1456 rows. It means we have successfully removed 4 outliers from our dataset.

Note: Tree based algorithms are usually robust to outliers and handle them automatically.

Tuesday 26 March 2019

Data Wrangling: How to convert dates into numbers in the dataset?

We should have all the numeric features in the dataset before running any Machine Learning algorithm on it to make predictions. But, in real world, we get different types of features (like string, categories, dates etc.) in the dataset. Today, we will see how can we deal with dates in the dataset? How can we convert dates into numbers?

When you load data into Pandas dataframe, dates are loaded as strings by default. We need to convert it into numeric columns.
  
First approach is to split date into multiple columns like year, month, day, hour etc.

Second approach is to convert dates into numbers based on the nature of the feature and domain knowledge.

Consider a scenario where dataset has date of birth column. Now, we know we can't simply drop this column as it has a significant impact on the dependent variable. We can create a new feature out of it. We can create age column from date of birth column by subtracting date of birth from today's date. In this way, we will get a numeric column.

Consider another scenario where we have a dataset of credit card users. We have to find out which customers generally delay their credit card payment and which customers pay on or before the due date. We have two columns called "Payment Due Date" and "Payment Date". Now these two date features are very crucial in our prediction but we cannot use these as such. So, we can create a new feature (say payment_on_time) by subtracting "Payment Due Date" from "Payment Date". 

payment_on_time (in days) = Payment Date - Payment Due Date

More positive the value of payment_on_time (in days), there is more delay in the payment.
More negative the value of payment_on_time (in days), there is less delay in the payment.

For example, Payment Due Date is 5th of March. Payment Date is 2nd of March. It means customer paid on time. So, the value of "payment_on_time" will be -3 (2 - 5).

I found some useful articles on web regarding handling of dates using pandas:
Article 1, Article 2, Article 3

Monday 25 March 2019

Data Exploration using Pandas Library in Python

Exploratory analysis of data is the mandatory step while creating a Machine Learning model. Pandas library provides various methods like head, tailshape, columns, info, dtypesdescribe, mean, var, std, corr for data exploration in Python.

We will load Ames Housing dataset in pandas dataframe and then explore it.

Load the dataset
import pandas as pd
dataset = pd.read_csv('train.csv')

Display rows and columns of the dataset
dataset  #displays all the rows and columns
dataset[['LotArea', 'LotShape']]  #displays all the rows and two columns

dataset.head()  #displays top 5 rows and all the columns
dataset.head(20)  #displays top 20 rows and all the columns
dataset['LotArea'].head()  #displays top 5 rows and one column
dataset[['LotArea', 'LotShape']].head() #displays top 5 rows and two columns

Similarly tail() is used to display bottom rows of the dataset.

Display number of rows and columns in the dataset
dataset.shape

Display number of rows in the dataset
dataset.shape[0]

Display number of columns in the dataset
dataset.shape[1]

Display the list of all the columns in the dataset
dataset.columns

Display summary of the columns in the dataset
dataset.info()

Display datatypes of all the variables
dataset.dtypes

Display statistical summary of the dataset like count, mean, standard deviation, min, max etc.
dataset.describe() 
dataset['LotArea'].describe()  #for one column
dataset[['Id', 'LotArea', 'Street', 'MSSubClass', 'SaleType]].describe()  #for some of the columns, it will simply ignore the non-numeric columns.

Display mean, variance and standard deviation
dataset.mean()
dataset.var()
dataset.std()

Display correlation
dataset.corr()

Display all the columns having null values
dataset.columns[dataset.isnull().any()]

Display columns with count of null values
dataset.isnull().sum()

Display count of null values in a particular column
dataset['PoolQC'].isnull().sum() 

Display count on null values in some selected columns
dataset[['PoolQC', 'MiscFeature', 'Alley', 'Fence', 'FireplaceQu']].isnull().sum() 

Display percentage of null values in each column
miss = dataset.isnull().sum() / len(dataset) * 100
miss = miss[miss > 0]
miss.sort_values(inplace=True)
miss

Hypothesis Generation: Null Hypothesis (Ho) vs Alternate Hypothesis (Ha) in Machine Learning

Hypothesis generation is a process of creating a set of features which could influence the target variable given a confidence interval (taken as 95% all the time). We can do this before looking at the dataset to avoid biased thoughts. This step often helps in creating new features. 

Domain knowledge is very important in hypothesis generation. Before looking at the data, you should know what important features it must have. Let us consider a Ames Housing dataset and our aim is to predict the house prices. What factors can you think of right now which can influence house prices? You should write down your factors as well, then we can match them with the features available in original dataset. 

Defining a hypothesis has two parts

1. Null Hypothesis (Ho) 
2. Alternate Hypothesis(Ha).

Ho - There exists no impact of a particular feature on the dependent variable. 
Ha - There exists a direct impact of a particular feature on the dependent variable.

Based on a decision criterion (say, 5% significance level), we always 'reject' or 'fail to reject' the null hypothesis in statistical parlance. Practically, while model building, we look for probability (p) values. If p value < 0.05, we reject the null hypothesis. If p > 0.05, we fail to reject the null hypothesis. 

Some factors which I can think of that directly influence house prices are the following:

Location of house
Area of house
Floors in the house
Age of house
Proximity to market, school, hospital, parks
Availability of public transport
Water / Electricity availability
Car parking
What material is used in the construction
If terrace is available
If security is available

In this way, you can think of a lot of features before looking into the database. As per my domain knowledge, above features must be there in the dataset as these features must influence the sales prices of the houses.

Saturday 23 March 2019

What is Factor Analysis? What is the difference between Exploratory Factor Analysis and Confirmatory Factor Analysis?

Factor Analysis is a statistical techniques used for dimensionality reduction in machine learning. Factor Analysis is used to reduce a large number of variables into fewer numbers of factors (variables) based on the correlation among the variables. It tries to capture maximum variance in the data with minimum number of variables. 

You can find more details about dimensionality reduction in my following articles:

Why is Dimensionality Reduction required?
Feature Selection and Feature Extraction Techniques
Difference between Covariance and Correlation
What is Multicollinearity?

Types of Factor Analysis

There are mainly two types of Factor Analysis:

1. Exploratory Factor Analysis (EFA)
2. Confirmatory Factor Analysis (CFA)

1. Exploratory Factor Analysis: It assumes that any indicator or variable may be associated with any factor. This is the most common factor analysis used by researchers and it is not based on any prior theory. Best example of Exploratory Factor Analysis is PCA (Principal Component Analysis). 

Advantages and Disadvantages of PCA
PCA vs t-SNE

2. Confirmatory factor analysis (CFA): It is used to determine the factor and factor loading of measured variables, and to confirm what is expected on the basic or pre-established theory. CFA assumes that each factor is associated with a specified subset of measured variables.

What is Binning? What is the difference between Fixed Width Binning and Adaptive Binning?

Binning is a quantization technique in Machine Learning to handle continuous variables. It is one of the important steps in Data Wrangling. Binning transforms the continuous variables into groups, ranges or intervals called bins.

For example, consider a dataset containing a variable which stores age of the people. This age is a continuous variable which can range from 1 to 100+. Analyzing this data is difficult. Using binning technique, we can convert all the values in this variable into ranges. 

Types of Binning 

There are two types of binning techniques: 

1. Fixed-Width Binning
2. Adaptive Binning

Lets discuss them one by one:

1. Fixed-Width Binning

We manually create fix width bins based on some rules and domain knowledge. Consider that we have following 15 values in the age column:

age = [12, 15, 13, 78, 65, 42, 98, 24, 26, 38, 27, 32, 22, 45, 27]

Now, lets create bins of fixed width (say 10):

bins = [0 {0-9}, 1 {10-19}, 2 {20-29}, 3 {30-39}, 4 {40-49}, 5 {50-59}, 6 {60-69}, 7 {70-79}, 8 {80-89}, 9 {90-99}]

After binning, our age variable looks like this:

age = [1, 1, 1, 7, 6, 4, 9, 2, 2, 3, 2, 3, 2, 4, 2]

In this way, all the 15 values will fit in above 10 ranges / bins. Just think of a dataset containing thousands of values in the age column instead of just 15! How useful it would be in this case!  

2. Adaptive Binning

In Fixed-Width Binning, bin ranges are manually decided. So, we usually end up in creating irregular bins which are not uniform based on the number of data points or values which fall under each bin. Some of the bins might be densely populated and some of them might be sparsely populated or even empty. 

For example, bins 0, 5 and 8 are empty in our case. 

In Adaptive Binning, data distribution itself decides bin ranges for itself. No manual intervention is required. So, the bins which are created are uniform in terms of number of data points in it.

Quantile based binning is a good strategy to use for adaptive binning. Quantiles are specific values or cut-points which help in partitioning the continuous valued distribution of a specific numeric field into discrete contiguous bins or intervals. Thus, q-Quantiles help in partitioning a numeric attribute into q equal partitions. 

Popular examples of quantiles include the 2-Quantile known as the median which divides the data distribution into two equal bins, 4-Quantiles known as the quartiles which divide the data into 4 equal bins and 10-Quantiles also known as the deciles which create 10 equal width bins.

Advantage of Binning: It finds a set of patterns in continuous variables which are easy to analyze and interpret

Disadvantage of BinningBinning leads to loss of information. The original data is converted into the bins.

Friday 22 March 2019

Implement Normalization in Python using Scikit Learn Library

Normalization and Standardization are Feature Scaling techniques in Machine Learning. Normalization converts the values into the range of 0 and 1. Today, we will see how is normalization implemented in Python using Scikit Learn library?

We will use California Housing dataset and normalize the "Total Bedroom" feature. You can download this dataset from here and my Jupyter notebook from here

Generally, we should normalize all the numeric features of the dataset but for the sake of simplicity, I will do it only for one feature.

Step 1: Load the required libraries like pandas, numpy and sklearn

import pandas as pd
import numpy as np
from sklearn.preprocessing import normalize

Step 2: Load the dataset

dataframe = pd.read_csv('california_housing_train.csv')

Step 3: Normalize the feature

x_array = np.array(dataframe['total_bedrooms'])
x_normalized = normalize([x_array])
x_array
x_normalized

Related
Normalization vs Standardization
Why are Normalization and Standardization required?

Thursday 21 March 2019

Implement Imputer in Python using Scikit Learn Library

Imputer class present in Scikit Learn library is used to replace the missing values in the numeric feature with some meaningful value like mean, median or mode. Lets see its implementation in Python using sklearn library.

You can download my Jupyter notebook implementing Imputer from here.

Step 1: Import the required libraries like pandas, numpy and sklearn

import pandas as pd
import numpy as np
from sklearn.preprocessing import Imputer

Step 2: Create a pandas data frame

dataframe = pd.DataFrame()
dataframe['Feature_1'] = [0.42,0.56,0.36,0.90,0.98,0.64,0.76,0.56,0.39,0.77]
dataframe['Feature_2'] = [np.nan,0.90,0.75,0.45,np.nan,0.88,0.67,0.34,0.72,0.28]
dataframe

I have added two features (added 10 values in each feature) in this data frame and deliberately put two nan values in the second feature. We will impute these nan values using Imputer class present in sklearn library.

Step 3: Impute nan values with mean value using Imputer class

imputer = Imputer(missing_values='NaN', strategy='mean', axis=0, verbose=0, copy="True")
dataframe = imputer.fit_transform(dataframe.values)
dataframe

Explanation of Imputer class parameters:

missing_values — This is the value which has to be replaced in the dataset. This could either be an integer, or NaN. If you don’t pass this value, NaN will be the default value. So, wherever we have NaN in our dataset, the Imputer object will replace it with a new value.

strategy — This is the strategy we’ll be using to calculate the value which has to replace the NaN occurrences in the dataset. There are three different strategies we can use: meanmedianmost_frequent.

axis — This can take one of two values — 0 and 1. This will decide if the Imputer will apply the strategy along the rows or along the columns. 0 for columns, and 1 for rows.

verbose — This will just decide the verbosity of the Imputer. By default, it’s set to 0.

copy — This will decide if a copy of the original object has to be made, or if the Imputer should change the dataset in-place. By default, it is set to True.

Feature Scaling Techniques: Difference between Normalization and Standardization

Both Normalization and Standardization are the feature scaling techniques which help in dealing with variables of different units and scales. This is a very important step in the data preprocessing and data wrangling.

For example, consider an Employee dataset. It contains features like Employee Age and Employee Salary. Now Age feature contains values on the scale 22-60 and Salary contains values on the scale 10000-100000. As these two features are different in scale, these need to be normalized and standardized to have common scale while building any Machine Learning model. Some algorithms have this feature built-in, but for some algorithms you must do it.

Here, Salary feature is dominating the Age feature. So, if we don't want one variable to dominate other, then we use either Normalization or Standardization. 

Disadvantage of Feature Scaling: Both Age and Salary will be in same scale after using standardization or normalization, but we will lose original values as it will get transformed to some other values. So there is loss of interpretation of the values in the feature but in return our model becomes consistent. 

Normalization

Normalization scales the values of a feature into a range of [0,1].

Xnew = (X – Xmin) / (Xmax – Xmin)

Disadvantage of normalization over standardization is that it loses some information in the data, especially about outliers. 

It will be useful when we are sure enough that there are no anomalies (i.e. outliers) with extremely large or small values. For example, in a recommendation system, the ratings made by users are limited to a small finite set like {1, 2, 3, 4, 5}

Standardization 

Standardization refer to the subtraction of the mean (μ) and then dividing by its standard deviation (σ). Standardization transforms your data such that the resulting distribution has a mean of 0 and a standard deviation of 1.

Xnew = (X - µ ) / σ

For most of the applications, standardization is recommended over normalization. For more details on Standardization, please go through my this post.

Wednesday 20 March 2019

What is Multicollinearity? What is Structural and Data Multicollinearity?

Multicollinearity is a situation in which two or more predictor (independent variables) in a model are highly correlated. 

For example, you have two explanatory variables – ‘time spent on treadmill in minutes’ and ‘calories burnt’. These variables are highly correlated as the more time you spend running on a treadmill, the more calories you will burn. Hence, there is no point in storing both as just one of them does what you require. 

Generally, if the correlation between the two independent variables is high (>= 0.8), then we drop one independent variable, otherwise it may lead to multicollinearity problem. If the degree of multicollinearity between the independent variables is high enough, it can cause problems when you fit the model and interpret the results.

Collinearity is a linear association between two explanatory variables. Two variables are perfectly collinear if there is an exact linear relationship between them.

Types of Multicollinearity

1. Structural Multicollinearity: This type of multicollinearity occurs when we create a variable based on the another variable while creating the model. For example, there is a variable say "x", and you create another variable based on the "x" say "y" where y=cx (c is any constant). In this case, both "x" and "y" are correlated variables.

2. Data Multicollinearity: This type of multicollinearity is present in the data itself. So, we need to identify it during the data wrangling process.

How to remove correlated variables?

Following techniques are used to handle multicollinearity problem in a dataset:

1. PCA (Principal Component Analysis)
2. SVD (Singular value Decomposition)

Related: Covariance vs Correlation

Tuesday 19 March 2019

Data Wrangling Techniques: Steps involved in Data Wrangling Process

Data Wrangling is the first step we take while creating a Machine Learning model. This is the main step in which we prepare data for a Machine Learning algorithm. This step is very crucial and takes up to 60 to 80 percent of time. 

In Data Wrangling, we convert the raw data into a suitable format which we can input to any Machine Learning algorithm. Data Wrangling and Data Preprocessing terms are used interchangeably. Data Wrangling is an art. You should have a lot of patience while making your data fit for Machine Learning algorithm. 

Lets see what are the various steps one should take while Data Wrangling?

1. Drop unnecessary columns

1A. Drop the columns which contain IDs, Names etc. 

For example, in Titanic dataset, we can easily drop Passenger Id, Passenger Name and Ticket Number columns which are not required for any kind of prediction. Read more...

1B. Drop the columns which contain a lot of null or missing values

The columns which contain around 75% of missing values should be dropped from the dataset. For example, in Titanic dataset, cabin column contains 687 null values out of 891 observations (77% missing values). So, it makes sense to drop this column from the dataset. Read more... 

Visualize missing values using Bar Plot

1C. Drop the columns which have low variance 

You can drop a variable with zero or low variance because the variables with low variance will not affect the target variable. If all the values in a variable are approximately same, then you can easily drop this variable. 

For example, if almost all the values in a numerical variable contain 1, then you can drop this variable.

2. Remove rows containing null values

If there are around 10-15% observations which contain null values, we can consider removing those observations. Read more...

3. Remove noise

Noise a is data that is meaningless, distorted and corrupted. Noise includes invalid values, outliers and skewed values in the dataset. We need to remove this noise before supplying this dataset to an algorithm. Domain knowledge plays an important role in identifying and removing the noisy data.

3A. Replace invalid values

Many times there are invalid values present in the dataset. For example, in Pima Indian Diabetes dataset, there are zero values for Blood Pressure, Glucose, Insulin etc. which is invalid. So, we need to replace these values with some meaningful values. Domain knowledge plays a crucial role in identifying the invalid values. Read more...

3B. Remove outliers

It is very important to remove outliers from the dataset as these outliers adversely affect the accuracy of the algorithms.

What are outliers? How to remove them?

3C. Log Transform Skewed Variables

We should check distribution for all the variables in the dataset and if it is skewed, we should use log transformation to make it normal distributed.

What is Skewnesss? How to visualize it with Histogram and how to remove it?
How to visualize skewness of numeric variables by plotting histograms?
Log Transforming the Skewed Data to get Normal Distribution

4. Impute missing values

Step 2 is usually not recommended as you may lose significant data. So, better try imputing the missing values with some meaningful values.

For numeric columns, you can impute the missing values with mean, median or mode. Read more...

Implementation of Imputer in Python

For categorical columns, you can impute the missing values by introducing a new category or with the category which is most frequently used. Read more...

5. Transform non-numeric variables to numeric variables

There are numeric and non-numeric variables in the dataset. We need to handle these differently. 

How to separate numeric and categorical variables?

5A. Transform categorical variables to dummy variables

To transform categorical variables to dummy variables, we can use LabelEncoder, OneHotEncoder and get_dummies methods present in Scikit Learn and Pandas library in Python.

5B. Transform date variables to numeric variables

By default, dates are treated as string values. We should convert it to numeric one.

How to convert dates into numbers in the dataset?

6. Feature Engineering

Feature Engineering involves Binning, Scaling (Normalization and Standardization), Dimensionality Reduction etc. We need to standardize and normalize all the features in the dataset before running any algorithm on the dataset. Standardization and Normalization are the feature scaling techniques which bring down all the values on the same scale and range. Features should be numeric in nature.

Binning Technique
Importance of Feature Scaling
Standardization vs Normalization
Implement Normalization in Python
Which algorithms require scaling and which not?

7. Dimensionality Reduction

Dimensionality reduction is required to remove the correlated variables and maximize the performance of the model. Basic techniques used for dimensionality reduction are:
  • PCA (Principal Component Analysis)
  • SVD (Singular Vector Decomposition)
  • LDA (Linear Discriminant Analysis)
  • MDS (Mulit-dimension Scaling)
  • t-SNE (t-Distributed Stochastic Neighbor Embedding)
  • ICA (Independent Component Analysis)
Please go through my previous posts on dimensionality reduction to understand the need of this step.

Multicollinearity
Covariance vs Correlation
Visualize correlation score using Heatmap
Feature Selection and Feature Extraction
Need of Dimensionlity Reduction
Factor Analysis
PCA, t-SNE, PCA vs t-SNE 
Implement PCA in Python

8. Splitting the dataset into training and testing data

We should not use the entire dataset to train a model. We should keep aside around 20% of data to test the accuracy of the model. So, usually we maintain a ratio of 80:20 between training and testing datasets.

About the Author

I have more than 10 years of experience in IT industry. Linkedin Profile

I am currently messing up with neural networks in deep learning. I am learning Python, TensorFlow and Keras.

Author: I am an author of a book on deep learning.

Quiz: I run an online quiz on machine learning and deep learning.